
Health Center Intelligence
Creating MVP for US healthcare analytics platform
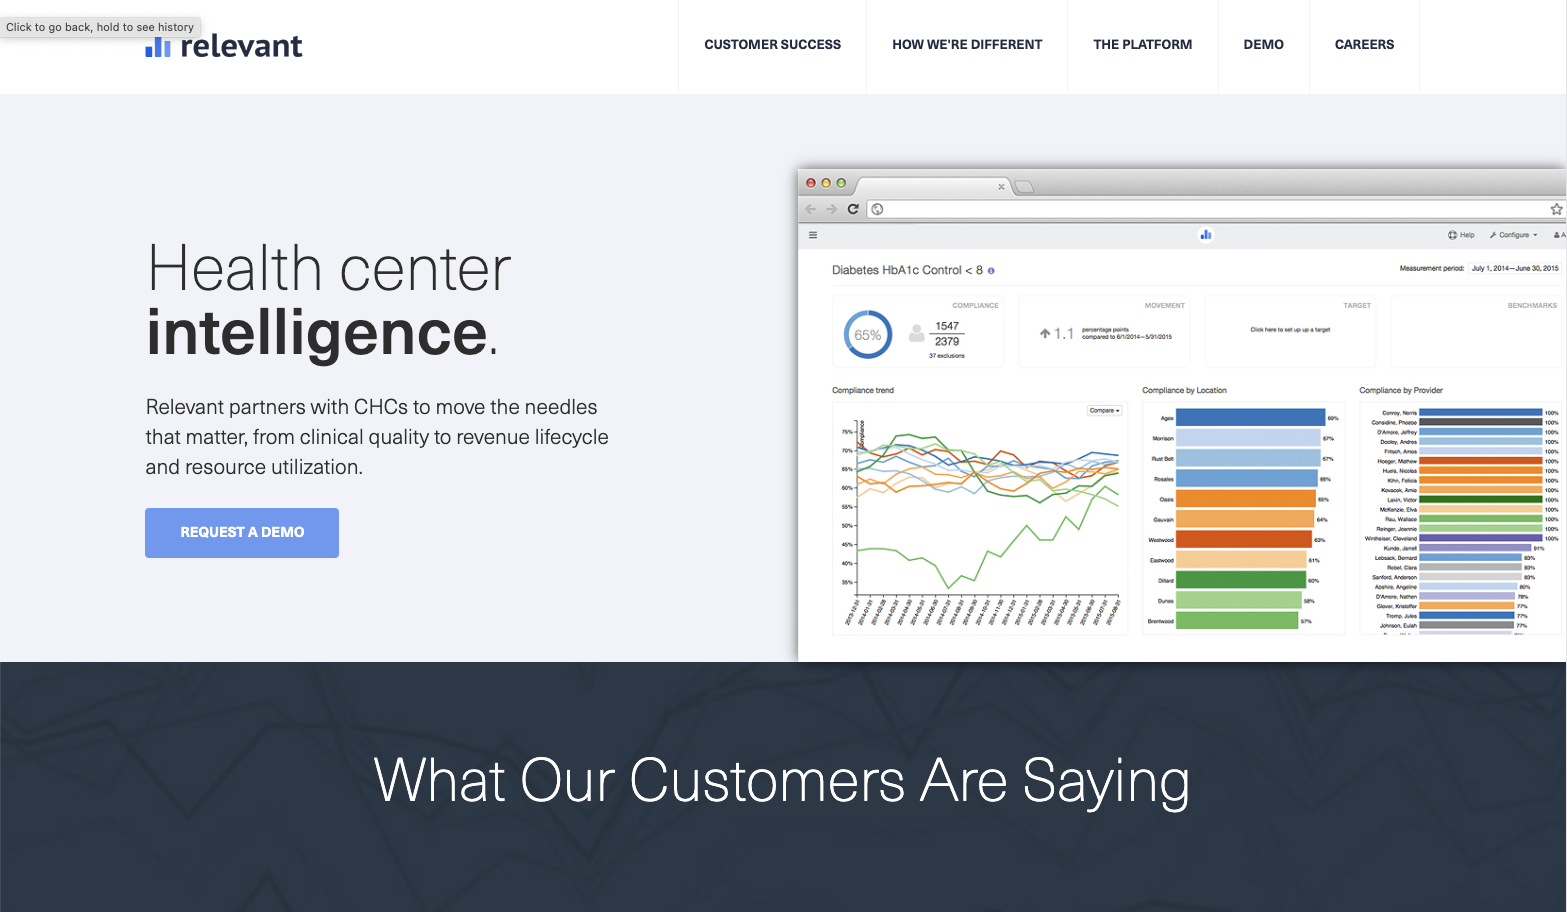
Reporting and analytics platform tailored for US healthcare.
Relevant builds web-based software for healthcare organizations. Their flagship product is used by Community Health Centers to gain insight into clinical quality, revenue lifecycle, and resource utilization.
The Challenge
Running a Community Health Center requires dozens of questions to be answered each day. The answers for those questions are stored within Electronic Health Records databases and can be retrieved in a form of reports.
The challenge we faced was to deliver an easy to use and elegant tool that allows for non-complicated creation and generation of reports that require just a briefly trained person.
Our Solution
Duration: 7 Months
Service: Development of Analytics for Health Centers
Technologies: Ruby on Rails, React, SQL Query Builder, PivotTable.js
Our Approach
Setting the Stage
We had a great opportunity to deal with the client experienced in IT, that already had a vision for solving the challenge. The guys from Relevant provided us with a set of high-level requirements for the features. Our technical Project Manager prepared lo-fi mockups for all the features and a detailed product backlog with descriptions of the scope.
Kicking it Off
We started the works with a kick-off meeting. Our development team, Project Manager and Relevant's Product Manager gathered to explain the domain of the project and its goals. The time zone difference became an advantage - when we sent features for approval, they could review them during our off hours, allowing us to handle remarks first thing in the morning.
Technology Choice
From the very beginning we knew that we would be building a part of an already existing application. Our part needed to seamlessly fit into the other parts. This concerned application's look & feel and most of the technologies used for both frontend and backend. We had the freedom to choose the technology for graphical data representation. PivotTable.js was a perfect choice for this purpose.
Agile Development
Our Client wanted their users to get the value out of the new features as soon as possible. We cooperated with Relevant to define a consistent roadmap and releases. Having learned what's to be done exactly, we gathered the best team and delivered the solution in iterative sprints.
Key Features
Report Builder
Report Builder allowed Health Center's Analysts to create and publish the reports based on data from multiple databases. We provided a database schema browser with search and point-and-click function for the ease of use. Reports were based on SQL query editor with syntax highlighting and autocomplete hints. Erroneous parts of SQL query were automagically highlighted after a query run.
Parametric Reports
Report feature was meant for Health Center's Analysts to create new reports that they can then give to their non-technical staff who can self-serve the data they need. We created a pseudo-language that allowed to embed custom parameters to SQL queries. Once published, users were able to generate reports with report parameters defined by them.
Report Results
Analyst was able to define multiple views to present report's results in both tabular and graphical form. Configuration of each view was saved within the Report, so other users could browse the results with ease. Report's results can be exported to XLS file format for easy offline browsing and analysis.
Their team was friendly, communicative, met deadlines, and delivered a stable output on both fronts. Their project manager is very knowledgeable and kept the process flowing effectively while following an effective Agile methodology.
Jacob Hodes